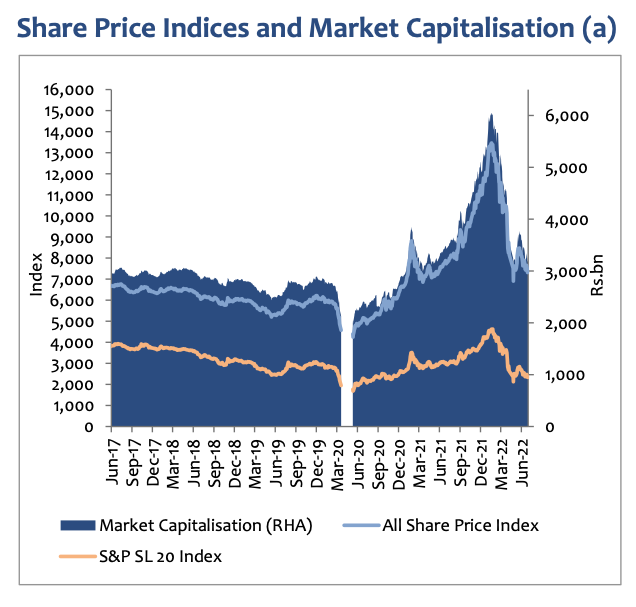
- Colombo Stock Exchange (CSE) Market Capitalisation declined more than 30% (LKR terms) and 61% (USD terms) during 2022.
- In Dec 2021, market cap stood at LKR. 5,489 bn (USD 27.5bn) whilst current market cap is LKR 3,888 bn (USD 10.7bn).
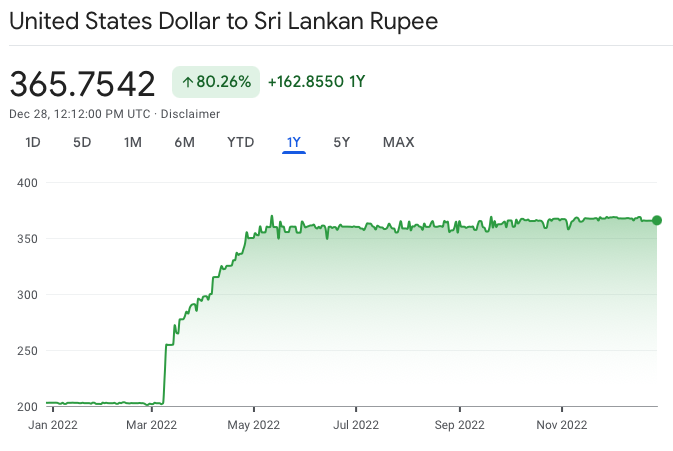
- During the same period LKR depreciated from LKR 200/= to current LKR 365/= against the USD Exchange Rate.
- Sri Lanka's stock market capitalisation in Dec 2022 as a% to Gross Domestic Product (GDP) was 14.86% compared to 10 year high of 36.7% in Dec 2021.
- The GDP of Sri Lanka decreased by 17% to USD 73.74 bn in 2022.
The colombo stock market recorded a decline during the year 2022 due to economic crisis faced by the country on the back drop of covid pandemic.
The All Share Price Index (ASPI) and Standard & Poor’s Sri Lanka 20 (S&P SL 20) index recorded decline of 31 per cent and 38 per cent, respectively, during the year 2022.
The market capitalisation stood at LKR. 3,888 billion as at end 2022 recording a decline of more than 30 per cent from LKR. 5,489 billion in Dec 2021 .
At the end of 2022 the USD/LKR Exchange rate was at LKR 365/= compared to LKR 200/= year before.
Further, market capitalisation as a percentage of GDP reached a 10-year high of 36.7 per cent at end 2021 compared to 19.7 per cent at end 2020.
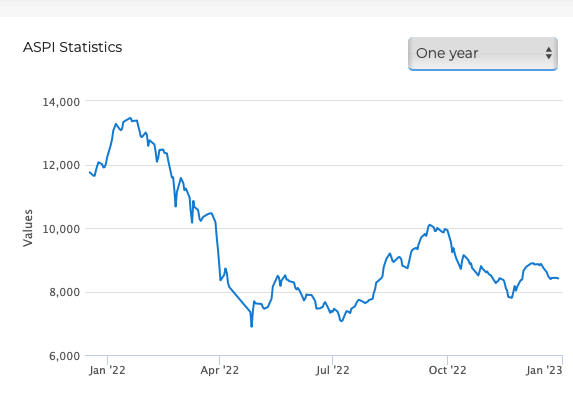
Movement of the All Share Price Index during 2022
The ASPI decreased 3815 points or 31.20% since the beginning of 2022, according to trading on a contract for difference (CFD) that tracks this benchmark index from Sri Lanka. Historically, the Sri Lanka Stock Market (CSE All Share) reached an all time high of 13,593 in January of 2022. As at end of 2021 ASPI was 12,226.
Sri Lanka's Sri Lanka CSE: Market Capitalization as a % of Gross Domestic Product (GDP): Annual from 1995 to 2017 in the chart:
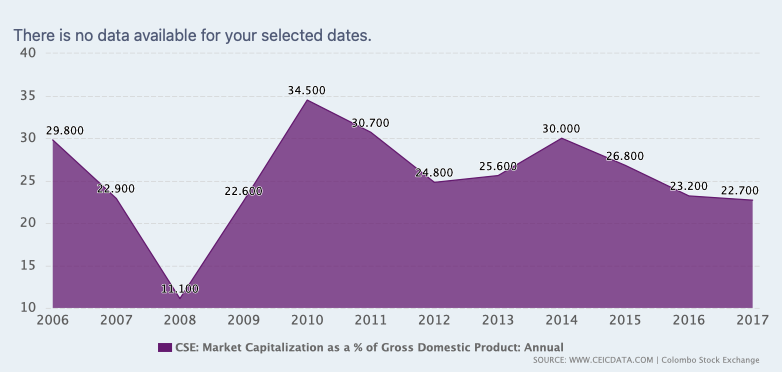
CSE: Market Capitalization as a % of Gross Domestic Product: Annual data was reported at 22.700 % in 2017. This records a decrease from the previous number of 23.200 % for 2016. CSE: Market Capitalization as a % of Gross Domestic Product: Annual data is updated yearly, averaging 22.600 % from Dec 1995 to 2017, with 23 observations. The data reached an all-time high of 34.500 % in 2010 and a record low of 1.400 % in 1996. CSE: Market Capitalization as a % of Gross Domestic Product: Annual data remains active status in CEIC and is reported by Colombo Stock Exchange. The data is categorized under Global Database’s Sri Lanka – Table LK.Z005: Colombo Stock Exchange: Market Capitalization. Starting 2010, Market Capitalization as a % of GDP has been recalculated in lieu with the rebasing of Gross Domestic Product (2010 Base).
https://www.ceicdata.com/en/sri-lanka/colombo-stock-exchange-market-capitalization
Gross domestic product (GDP) in Sri Lanka 2022
The gross domestic product in current prices in Sri Lanka decreased to 73.74 billion U.S. dollars since the previous year. This means a decline of 15.2 billion U.S. dollars (-17.08 percent) in 2022. Accordingly Sri Lanka's current market capitalisation in USD terms as a% to GDP has fallen to 14.86% in December 2022 from a 10 year high of 36.7% in December 2021.
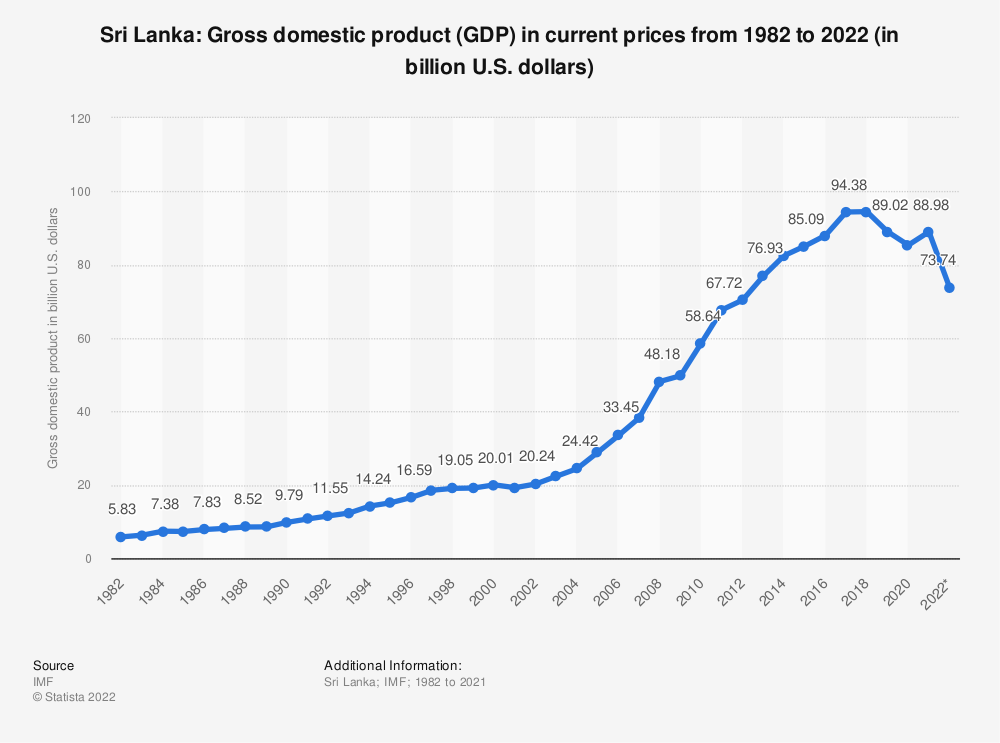
This indicator describes the gross domestic product at current prices, consistent with the definition given by the International Monetary Fund. This means that the values are based upon the GDP in national currency converted to U.S. dollars using market exchange rates (yearly average). The GDP represents the total value of final goods and services produced during a year
Movement of the USD/LKR Exchange Rate during 2022
Historically, the Sri Lankan Rupee reached an all time high of 372.00 in May of 2022. Sri Lankan Rupee - data, forecasts, historical chart - was last updated on December of 2022.
https://www.cbsl.gov.lk/sites/default/files/cbslweb_documents/publications/annual_report/2021/en/12_Chapter_08.pdf
 would enable you to enjoy an array of other services such as Member Rankings, User Groups, Own Posts & Profile, Exclusive Research, Live Chat Box etc..
 Home
Home


