would enable you to enjoy an array of other services such as Member Rankings, User Groups, Own Posts & Profile, Exclusive Research, Live Chat Box etc..
 Latest*


[img]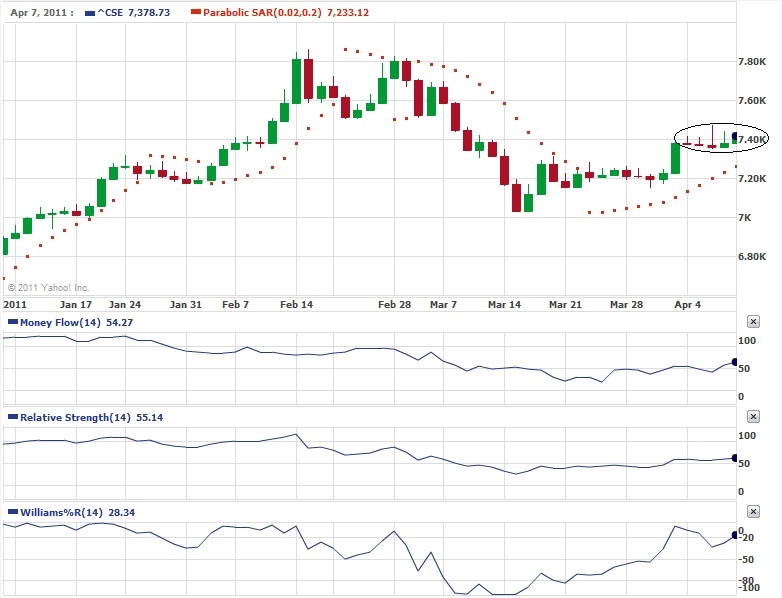 [/img]
Just look at chart, I believe Candlestick charts very much.. because it interpret current market trends and how much powerful the current trend. Just see, the highlighted area.
that mean, bulls are trying to take over the market phase, but bears are still able to kept low the market. all other indexes are neutral and they can support both uptrend or down trend. but candles said, bears are getting tiered. look at time line or controlled bull trend. then, i guess there may be a sudden blasts time to time, but long term bull trend is signaling.
this is a transition period. new set of investors are entering while lot of investors taking their profits.
market ready to break its silent gradually.
finally, second phase of the year would be a steady bull market for fundamental stocks. since ASI is climbing others also can have a good future.
Happy 2nd half of the year.
[/img]Just look at chart, I believe Candlestick charts very much.. because it interpret current market trends and how much powerful the current trend. Just see, the highlighted area.
that mean, bulls are trying to take over the market phase, but bears are still able to kept low the market. all other indexes are neutral and they can support both uptrend or down trend. but candles said, bears are getting tiered. look at time line or controlled bull trend. then, i guess there may be a sudden blasts time to time, but long term bull trend is signaling.
this is a transition period. new set of investors are entering while lot of investors taking their profits.
market ready to break its silent gradually.
finally, second phase of the year would be a steady bull market for fundamental stocks. since ASI is climbing others also can have a good future.
Happy 2nd half of the year.