friends i m just adding to here with my little knowledge and i always welcome your ideas.

when concentrating on chart philosophy as i ve noted above, big buyers and sellers will always follow chart patterns . so if we get our self used to it we also can get in to the boat at the correct time and can exit without getting our hands burned.
studying chat patterns is a vast area , i suppose . there are various types of chart indicators.. as an example ,simple chart patterns , moving averages , RSI , MFI , MACDs , stothastics , momentum , harmonics , ... and much more. but i think it will be better to get familiar with some indicators and to get master on it. so we ll be able to earn some bread n butter .... even much more .
At the early stage of an investor in CSE i feel it will be good to get hurt at the beginning rather than at the end. so new be can start with small amount .. even at lost can earn some valuable experience and recover back with huge capital gain at the end. otherwise loosing all the eggs at the end will end up in ST elevated Miocardial elevation with troponin positive.
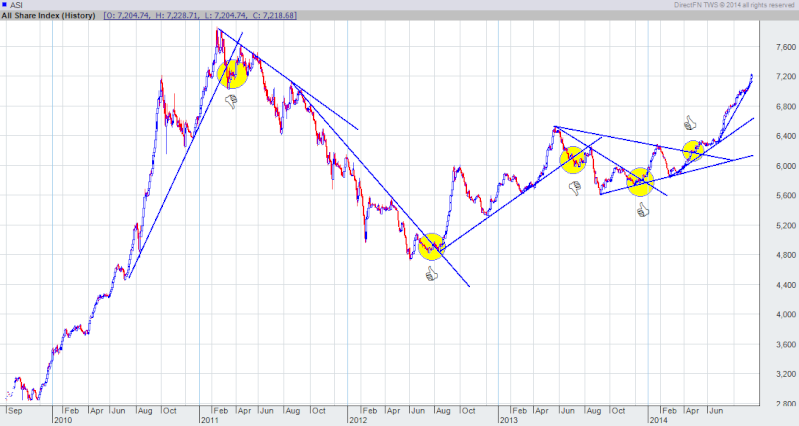
here i do conc on some patterns with apexs as lux highlighted. there are 4 types of apexes i observed that do form . and it should be remembered that all apexes will not end up with upward surge. it can go downward even following .

so as shown apex can be end up with up surge or down bottom.
why does an apex form..
just think about X stock . at a bottom down cool stage ppl will collect it . and if it is noted with growth potential it starts positive movement ,which drags to a resistance level . and at the resistance it will pulled back to support level . on then it attracts buying so it goes up again.
on this movement long term investors will hold , day traders will drop with Small margin. when this drop is seen by ppl who are not confident to hold will drop too . but if the stock has growth potential it will move forward again. but when ever its coming back to resistance level it can be pulled down by sellers who tries to exit who may be on margin ..etc.. like wise this up down movement goes forward for a period.
on this movement a positive factor we can identify is that green volume is higher than the red volume.
to have a sound idea to note its good to analyse RSI, moving averages 20,50 , volumes ,bolinger bands mainly .. there may be more ....

while this journey goes on a positive factor or negative factor will determine the final wave .. up or down..
positive factors can be ... profits , reports , directors buying in , mergers , rumors
negative factors can be.... loss , forign selling , capital loss , economic cricis......
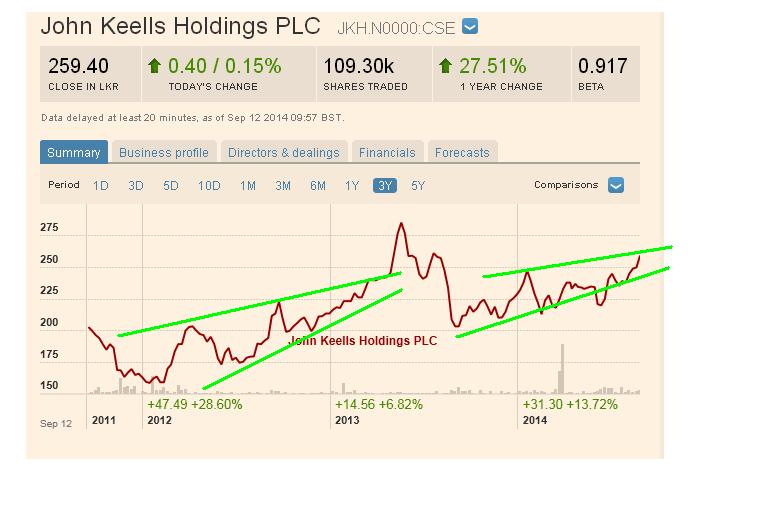
here just have a look at the following ex.. KAPI , JKH , TAFl which i think most of us have traded even once in our life in CSE..
Kapi .. rather than small apexes , it had a big continuous concentration . it burst off with good green volume , with its improved performance.

Have a look at JKH too .. same situation
have a look at TAFL too
it had two consecutive surges and at the end it was droped with huge red volume.mainly due to poor performances.

so here i ve just given some brief idea .. i d like to have some of you vauble comments to improve more n more
 would enable you to enjoy an array of other services such as Member Rankings, User Groups, Own Posts & Profile, Exclusive Research, Live Chat Box etc..
 Latest*