would enable you to enjoy an array of other services such as Member Rankings, User Groups, Own Posts & Profile, Exclusive Research, Live Chat Box etc..
 Latest*


Introduction
A double bottom occurs when prices form two distinct lows on a chart. A double bottom is only complete, however, when prices rise above the high end of the point that formed the second low.
The double bottom is a reversal pattern of a downward trend in a stock's price. The double bottom marks a downtrend in the process of becoming an uptrend.
Double bottoms are often seen and are considered to be among the most common of the patterns. Because they seem to be so easy to identify, the double bottom should be approached with caution by the investor.
According to Schabacker, the double bottom is a "much misunderstood formation." Many investors assume that, because the double bottom is such a common pattern, it is consistently reliable. This is not the case. Bulkowski estimates the double bottom has a failure rate of 64%, which he terms surprisingly high.If an investor waits for a valid breakout, however, the failure rate declines to 3%. The double bottom is a pattern, therefore, that requires close study for correct identification.
What does a double bottom look like?
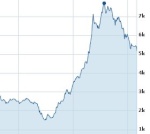
As seen below, a double bottom consists of two well-defined lows at approximately the same price level. Prices fall to a support level, rally and pull back up, then fall to the support level again before increasing.

Analysts vary in their specific definitions of a double bottom. According to some, after the first bottom is formed, a rally of at least 10% should follow. That increase is measured from high to low. According to Edwards and Magee, there should be at least a 15% rally following the first bottom. This should be followed by a second bottom. The second bottom returning back to the previous low (plus or minus 3%) should be on lower volume than the first. Other analysts maintain that the rise registered between the two bottoms should be at least 20% and the lows should be spaced at least a month apart.
There are a few points of agreement, however. Investors should ensure that the pattern is in fact comprised of two distinct bottoms and that they should appear at or near the same price level. Bottoms should have a significant amount of time between them - ranging from a few weeks to a year depending on whether an investor is viewing a weekly chart or a daily chart. Investors should not confuse a consolidation pattern with a double bottom. Finally, it is crucial to the completion of the reversal pattern that prices close above the confirmation point.
Why is this pattern important?
According to Murphy, the double bottom is one of the most frequently seen and most easily recognized. However, analysts agree that this can be a difficult pattern to correctly identify. Investors must pay close attention to the volume during the formation of the pattern, the amount of increase between the two lows, and the time the pattern takes to develop on the chart.
Murphy explains that bottoming patterns may have smaller price ranges than topping patterns and often take longer to build. "For this reason, it is usually easier and less costly to identify and trade bottoms than to catch market tops."
It is quite common after prices reach a new low for a rebound in prices to occur. A retest of the low then usually follows. According to Bulkowski, a retest occurs when prices return to the low and test to see if the stock can support itself at that price level. "If it cannot, prices continue moving downward. Otherwise, the low usually becomes the end of the decline and rising prices result."
Is volume important in a double bottom?
Investors should pay close attention to volume when analyzing a double bottom.
Generally, volume in a double bottom is usually higher on the left bottom than the right. Volume tends to be downward as the pattern forms. Volume does, however, pick up as the pattern hits its lows. Volume increases again when the pattern completes, breaking through the confirmation point.
Monitoring volume is a key aspect of determining whether or not a double bottom is valid.
Schabacker insists that the volume rule must be applied quite strictly in the case of a double bottom.Elaine Yager, Director of Technical Analysis at Investec Ernst and Company in New York and a member of Recognia's Board of Advisors, strongly agrees with this point. The first low must be made with noticeably high volume. The second low must also experience high volume but it need not achieve the level of the first low. Bulkowski explains that volume tends to rise substantially at the time of breakout.
What are the details that I should pay attention to in the double bottom?
1. Downtrend Preceding Double Bottom
As mentioned previously, the double bottom is a reversal formation. It begins with prices in a downtrend. Bulkowski cautions that on their way down, prices should not drift below the left low of the pattern.
2. Time between Bottoms
Analysts pay close attention to the "size" of the pattern - the duration of the interval between the two lows. Generally, the longer the time between the two lows, the more important the pattern as a good reversal. Schabacker warns investors off of a pattern where only a few days intervene between the two lows. Analysts suggest that investors should look for patterns where at least one month elapses between the bottoms. It is not unusual for a few months to pass between the dates of the two bottoms. Murphy mentions that these patterns can span several years.Yager notes, however, that tracking of bottoms that run for several years can become cumbersome and difficult. Bulkowski suggests that best gains come from formations where bottoms are approximately 3 months apart.
3. Increase from First Low
Some analysts argue the increase in price that occurs between the two bottoms should be consequential, amounting to approximately 20% of the price. Other analysts are not so definite or demanding concerning the price increase. For some, an increase of at least 10% is adequate. Yager strongly agrees with this point. The rise between the lows tends to look rounded but it can also be irregular in shape.
4. Volume
As mentioned previously, volume tends to be heaviest during the first low, lighter on the second. It is common to see volume pick up again at the time of breakout.
5. Decisive Breakout
According to Murphy, the technical odds usually favor the continuation of the present trend.This means that it is perfectly normal market action for prices on a downtrend to fall to a support level a couple of times, rise back up, and then resume that downtrend. It is a challenge for the analyst to determine whether the rise from the bottom is the indication of the development of a valid double bottom or simply a temporary setback in the progression of a continuing downtrend.Analysts, therefore, advise cautious investors to wait for the price to rise back up and break through the confirmation point before relying on the validity of the pattern. Many experts will maintain that an investor should wait for a decisive breakout, confirmed by high volume.
6. Pullback after Breakout
A pullback after the breakout is usual for a double bottom. Bulkowski estimates that in 68% of double bottom patterns, price will throwback to the breakout price.
How can I trade this pattern?
Begin by calculating the target price -of the minimum expected price move. The double bottom is measured in a way similar to that for the head and shoulders bottom.
Calculate the height of the pattern by subtracting the lowest low from the highest high in the formation. Then, add the height of the pattern to the highest high. In other words, an investor can expect the price to move upwards at least the distance from the breakout point plus the height of the pattern.
For example, assume the lowest low of the double bottom is 220 and the highest high is 290. The height of the pattern equals 70 (290 - 220 = 70). The minimum target price is 360 (290 + 70 = 360).
Murphy cautions the terms "double tops and bottoms" are greatly overused in the markets. Most of the patterns referred to as double bottoms are, in fact, something else. Because of this, Murphy advises investors to make their investment decisions only after prices have broken through the confirmation point, completing the reversal pattern.Watching the volume throughout the development of the pattern can help determine whether the pattern is a valid double bottom.
Yager notes that the key for this pattern is for the investor to have patience and wait for confirmation. Too often investors see double bottoms everywhere.
Edwards and Magee explain that patterns where the bottoms are close together in time are likely not valid double bottoms but are, in fact, a consolidation area.
Because so many double bottoms pullback after breaking through the confirmation point, it is often possible to wait for the pullback to place a trade and then watch prices decline for a second time. Bulkowski estimates that the average time for prices to return to the breakout price is 11 days. Throwbacks that occur 30 days after the breakout are not throwbacks at all, but simply normal price fluctuations.
Bulkowski offers advice for both short-term and long-term investors. Because only approximately 68% of double bottoms meet their price targets, he advises short-term investors to be ready to take profits as price nears the target. In other words, sell as prices get close to the target.Long-term investors, he suggests, can hold onto the stock for an extended upward move but should keep watch on the fundamentals to determine whether they are justified in continuing to hold the stock.
Are there variations in the pattern that I should know about?
1. Two Lows at Different Levels
Sometimes the two lows comprising a double bottom are not at exactly the same price level. This does not necessarily render the pattern invalid. Analysts advise that if the second low varies in price from the first low by more than 3% or 4%, the pattern may not be a double bottom.