How attractive is Central Industries $CIND at current MM?
$CIND is currently trading at 2.77 per (41% undervalued compared to the industry per)
Based on pbv, ev/ebitda , adjusted per (ttm) & navps,
Fair Value ~ 222
Upside ~ 271%

Here’s the valuation breakup as of 3Q22,
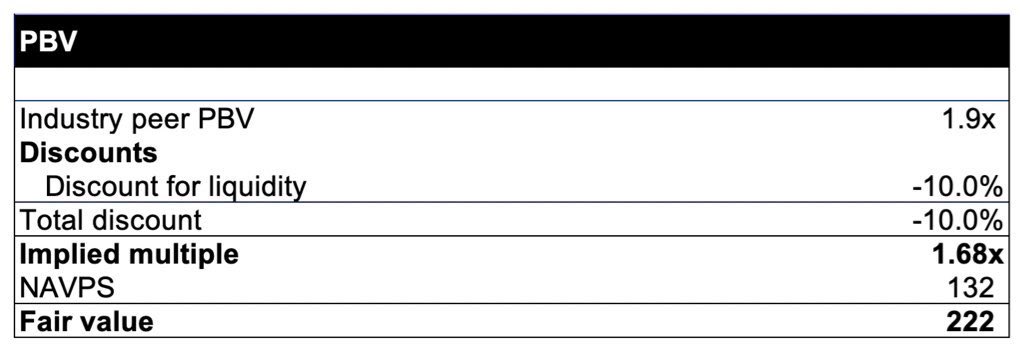
1. PBV
Median pbv of SPCSECGP (capital goods) is 1.9% (as of 31/12/2022)
$CIND is comparatively illiquid hence after a -10% illiquidity discount, implied multiple = 1.68X
This gives an FV of LKR 222 based on the implied pbv
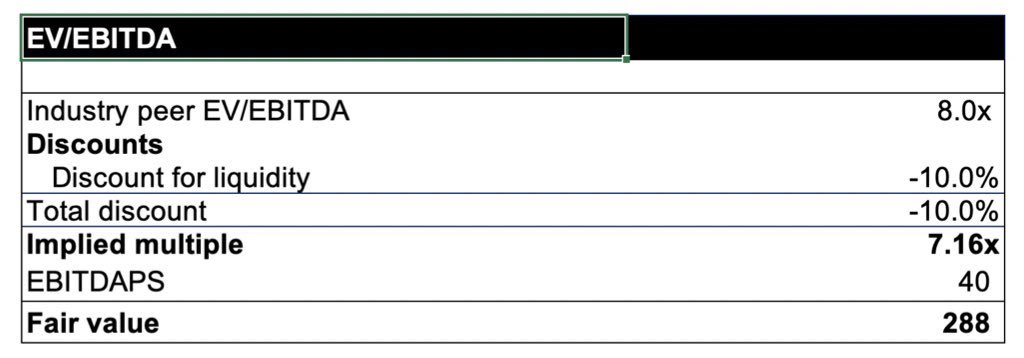
2. EV/EBITDA
Capital goods industry peers trade at a median of 8x ev/ebitda as of 31/12/2022
Pat/ebitda historical average is 54%; this translates $CIND eps ttm ~22 to 40.3 ebitda / share
After -10% illiquidy premium fv based on ev/ebitda = LKR 288
3. NAV &PER
$CIND bvps is 132.4 & eps ttm is 22 (as of 31/12/22)
Further, historical finance cost/revenue is ~1%, however due to heavy fx losses ttm finance cost has inflated to 820M (13% of revenue)
3. Cont.
After adjusting 13% finance cost to historical average (1%) new eps ttm is approx. 63
Based on the adjusted eps ttm $CIND currently trading at 0.95X per
$CIND fv at SPCSECGP per (3.90x) = 246
https://twitter.com/WidulDeelaka/status/1620871199520849922

 would enable you to enjoy an array of other services such as Member Rankings, User Groups, Own Posts & Profile, Exclusive Research, Live Chat Box etc..
 Latest*